The 100-day moving average (100-DMA) is a crucial indicator in technical analysis, offering insights into the overall trend of a security or market over a more extended period. Calculated by averaging the closing prices of the last 100 trading days, this moving average provides traders and investors with a smoothed trendline, aiding in decision-making. In this blog we will learn more about it and how it empowers traders in navigating the dynamic landscape of financial markets.
Table of Contents
Defining 100-Day Moving Average
The 100-day moving average is a technical indicator widely used by traders. It represents the average price of a stock over a period of 100 days or medium term. Like any other moving average, the 100-day moving average also helps traders analyse price trends. It primarily tells traders whether the stock is witnessing an uptrend or a downtrend. At the same time, the 100-day moving average also gives traders buy and sell signals.
Significance of 100-Day Moving Average
So, why should the 100-day moving average be used? The straightforward answer is to analyse medium term price trends. Traders have found 100 days or 20 weeks a suitable time frame to trade stocks in the medium term.
- The 100-DMA can evaluate whether the medium term price trend is trending upwards, sideways, or downwards. This indicator can be applied to individual stocks as well as indexes like the Nifty 50 and the Sensex.
- Since these indexes give a picture of the broader market, the 100-DMA can give an idea of the medium term market sentiment when applied to such indexes.
Calculating 100-Day Moving Average
To calculate the moving average for a time period x, one can take the average of the closing price x number. In other words, add up the closing prices (closing day price of day 1 + closing day price of day 2…. + closing day price of day x) and then divide the sum by x. In the case of the 100-DMA, x is equal to 100.
This said, one does not have to manually calculate the 100-DMA. The modern-day stock trading software and apps offered by brokers, like Share India, give the feature to apply the moving averages of any period to any price chart. So, to apply the indicator on the price chart, one simply needs to click the indicator symbol, select the moving average indicator, and configure it to 100 days. Once done, the 100-DMA is plotted on the chart, and it takes the shape of a smooth curve.
Understanding Working of 100-Day Moving Average
When the 100-day moving average is plotted on the price, one of these three scenarios occurs:
- The stock trades above the 100-DMA curve for an extended period: Here, the price trades sharply above the 100-day moving average for an extended period, exhibiting an uptrend. Such a scenario is indicative of bullish medium term market sentiment. In this scenario, the 100-DMA acts as a strong support, so if the price nears or touches the 100-DMA, it is likely to bounce back upwards. However, if it breaches the 100-DMA, it could signal the end of the uptrend and a trend reversal.
- The stock trades under the 100-DMA curve for an extended period: When stock prices are situated below the 00-DMA, it signals a downtrend in the market. This downward trend reflects a bearish sentiment in the medium term market outlook. In a downtrend, the 100-DMA acts as strong resistance; if the price nears or touches the 100-DMA, it is likely to face resistance and fall back downwards. Similar to the first scenario, if the price successfully cuts above the 100-DMA, the downtrend may cease, and you may witness a trend reversal.
- The stock continuously cuts under and above the 100-DMA frequently for an extended period: If the 100-DMA moves sideways for an extended period, the price cuts below and above the 100-DMA line several times. Such a scenario hints at an indecisive market where the sentiment is neither bearish nor bullish. The price trades in a range and consolidates for an extended period.
100-Day Moving Example Chart

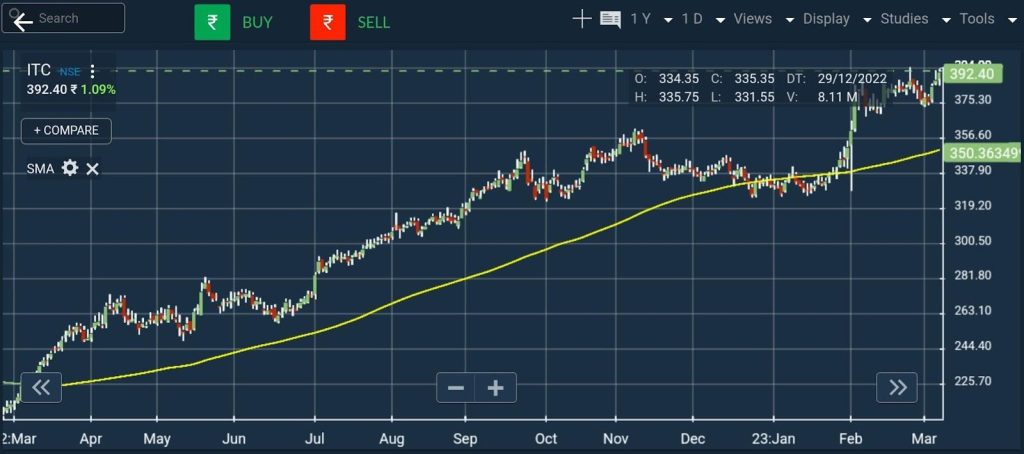
In the above illustration, the yellow line represents the 100-DMA, and since the price is trading above the 100-DMA, it depicts an uptrend. Here you can see that the price tends to take support and bounce back upwards whenever it nears or touches the 100-DMA line.
Trading Stocks Using 100-DMA
- The 100-DMA is primarily utilised for medium term price analysis, making it suitable for traders with a time horizon ranging from weeks to several years.
- When employing the 100-DMA in trading, the overarching strategy is to align with the prevailing trend. Buying opportunities are sought when the price is above the 100-DMA while selling strategies are considered when the price is below this moving average.
- Timing becomes crucial when executing trades based on the 100-DMA; entering a stock position as it crosses above the 100-DMA line and selling as it crosses below is a basic approach. Additionally, traders may capitalise on buying when the stock, in an uptrend, bounces off the 100-DMA as a support or take short positions when it, in a downtrend, encounters the 100-DMA as resistance.
- However, it’s essential to be mindful of certain nuances, as explained in the following section.
Limitations of 100-Day Moving Average Strategy
- Relying solely on the 1100-DMA for medium term trading opportunities is insufficient, given the complexity of stock trading.
- Stock trading strategies extend beyond simplistic approaches like buying when the price crosses above the 100-DMA or rebounds from it in an uptrend.
- The 100-DMA is not foolproof; crossing above it does not guarantee a sustained uptrend, and the price can reverse and fall back below it. Similarly, a price cutting below the 100-DMA doesn’t guarantee a definite sell signal.
- Sideways trends pose challenges for the 100-DMA, and its nature as a lagging indicator means that entry points are often missed due to delayed trend recognition.
Conclusion
To conclude, the 100-day moving average is an effective indicator that you can use to analyse price trends in the medium term. However, due to its lagging nature, it’s more often used as a trend confirmation indicator than to take buying positions or exit existing positions. So, to identify buying and selling signals, you can use the 100-DMA in conjunction with other indicators and price patterns.