Share India provides a suite of online trading tools designed to empower investors and traders with valuable information and analytical capabilities. These tools can be broadly categorized into real-time market indicators and financial calculators:
Real-time Market Indicators:
- VWAP (Volume Weighted Average Price): This tool provides a dynamic calculation of the average price a security has traded at throughout the trading day, taking into account both the price and the volume of shares traded at each price level. It’s a crucial indicator for understanding the prevailing market sentiment and identifying potential overbought or oversold conditions. Traders often use VWAP as a benchmark to assess whether they are getting favorable prices for their trades. Share India’s VWAP tool allows users to track this key metric in real-time.
- FII and DII Indicator: This indicator tracks the buying and selling activity of two major institutional investor groups: Foreign Institutional Investors (FIIs) and Domestic Institutional Investors (DIIs). FIIs are large investors from overseas, while DIIs are domestic institutions like mutual funds and insurance companies. Monitoring their trading patterns can provide valuable insights into market trends and potential shifts in investment sentiment. Share India’s FII and DII Indicator helps traders understand the participation of these influential players in the market.
Financial Calculators:
Share India offers a range of online calculators to assist traders and investors with various financial calculations:
- Dividend Yield Calculator: This tool helps investors determine the dividend yield of a stock, which is the annual dividend income per share divided by the stock’s current price. It’s a key metric for income-seeking investors. The Dividend Yield Calculator simplifies this calculation.
- Options Calculator: Options trading involves complex pricing models. Share India’s Options Calculator assists traders in calculating theoretical option prices based on various factors like the underlying asset’s price, strike price, time to expiration, volatility, and interest rates. This helps in making informed decisions about buying or selling options contracts.
- CAGR Calculator (Compound Annual Growth Rate): CAGR represents the annualised rate at which an investment grows over a specified period, assuming that gains are reinvested during the term. It’s a useful metric for evaluating the performance of investments over time. Share India’s CAGR Calculator simplifies this calculation.
- Brokerage Calculator: Trading involves brokerage charges. Share India’s Brokerage Calculator helps traders estimate the brokerage they will incur on their trades, allowing them to factor these costs into their trading decisions. This ensures transparency and helps traders manage their trading expenses effectively.
Additional Tools on the Web Trading Platform
- Charts:
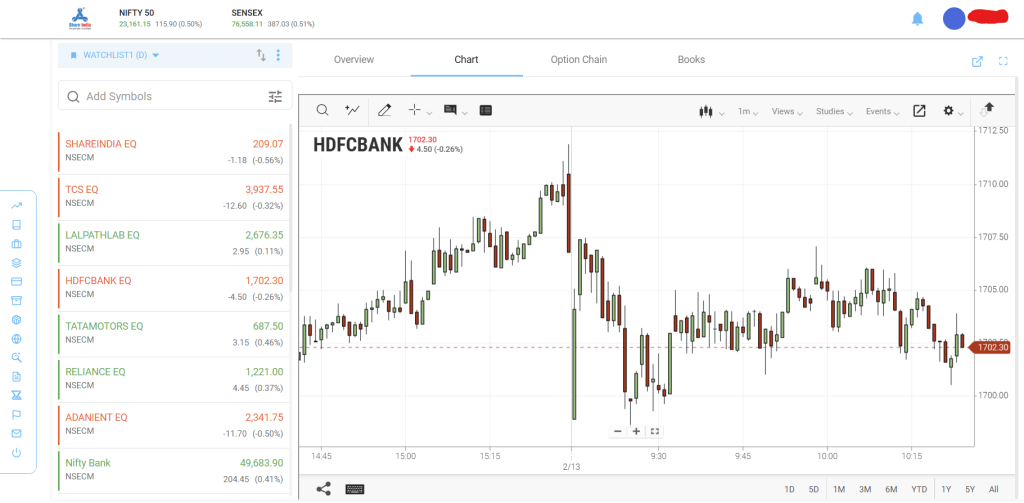
Clicking on the “Chart” tab displays a visual representation of the selected stock’s price movement over time. The chart typically includes:
- Price bars or lines: Showing the stock’s price fluctuations.
- Time axis: Indicating the period (intraday, daily, weekly, etc.).
You can customise the chart with:
- Technical indicators: Tools like moving averages, RSI, etc., to analyse trends.
- Drawing tools: To mark up charts for identifying patterns.
- Zoom and pan: To focus on specific time periods or price ranges.
Charts are essential for technical analysis, helping traders identify potential entry and exit points based on historical price patterns.
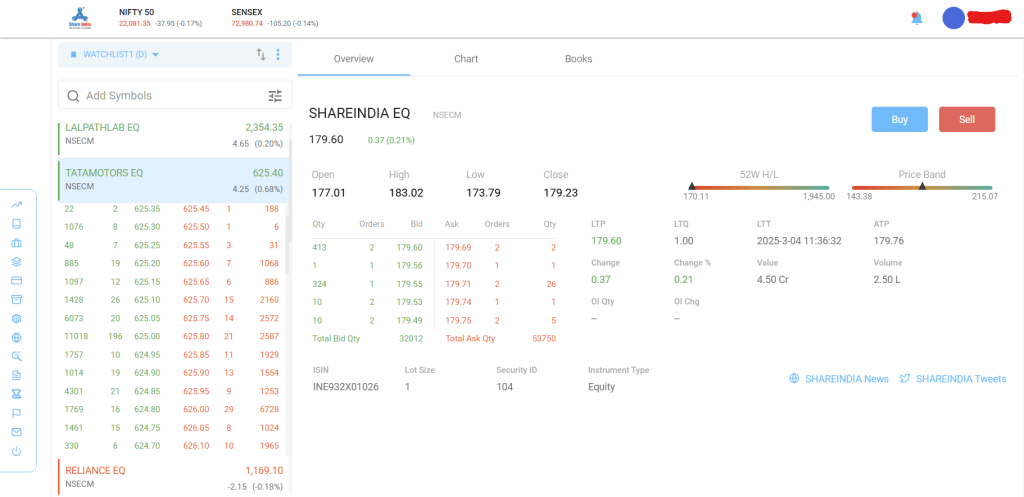
- 50 Market Depth: Share India’s 50 Market Depth feature significantly improves trading by offering a much more detailed view of market activity. Instead of the typical 5 or 20 best bid and offer prices, traders can see the top 50. This expanded view provides a clearer understanding of market trends, allowing for more informed trading decisions and the identification of potential opportunities that might be missed with standard market depth views. Essentially, Share India empowers traders with a comprehensive look at market depth, going beyond the limitations of standard views.
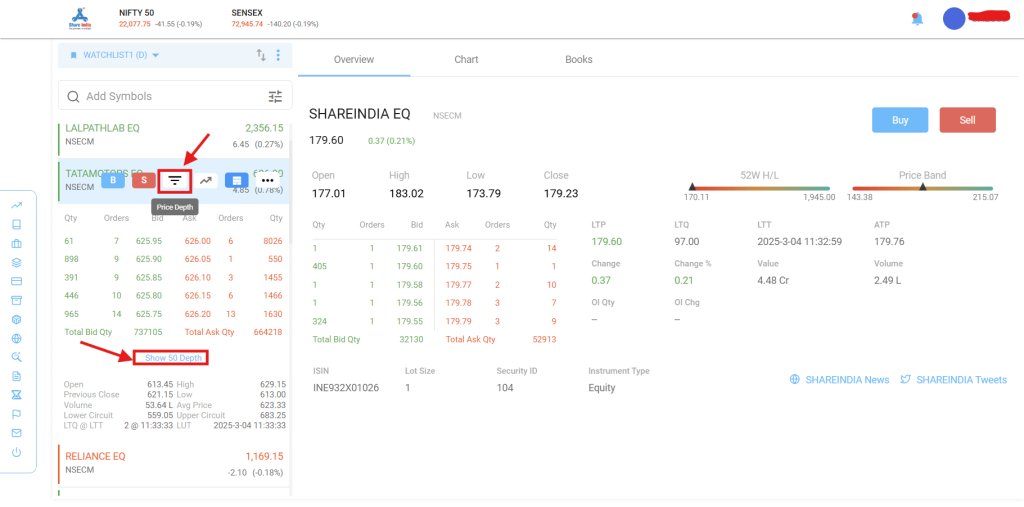
To view the 50 Market Depth, simply click on the “Price Depth” icon, scroll down, and then click on “Shot 50 Depth”.
To start online trading, all you need to do is open a Demat account and a trading account with Share India.
For the account opening process, visit.
If you have any questions or need further support, don’t hesitate to contact Share India’s support team. You can reach us at 18002030303 or email us at support@shareindia.com.